Outdated Resource Warning!
This is documentation for legacy version 0.x releases. If you are using 1.x see the wiki.
This is documentation for legacy version 0.x releases. If you are using 1.x see the wiki.
| << Working with Views | Contents | Test Scheduling >> |
Using Graphs Directly
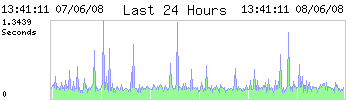
The standard dataset is shown above over the previous 24 hours. The range (y axes) max and min are the data max and min range. Colours and drawing options are default.
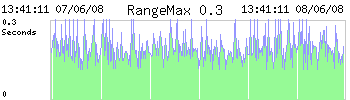
The same dataset/period is shown with rangemax set to 0.3.
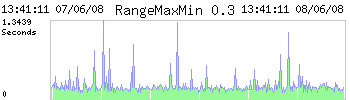
Setting rangemaxmin to 0.3 has no effect as data results higher than 0.3 are in the sample
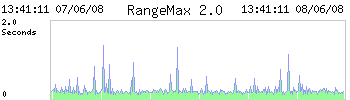
rangemax 2.0 is shown above
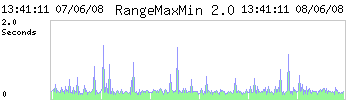
rangemaxmin 2.0 has the same effect as rangemax 2.0 as the data is no higher than 2.0
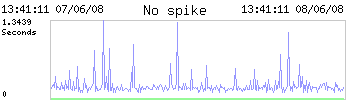
With draw_spike set to 0, draw_under and draw_pass set to 1
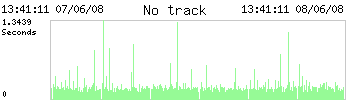
With draw_track set to 0, draw_under and draw_under_pass set to 1
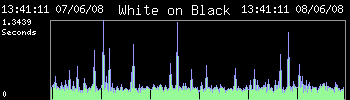
Colours specified to create a white-on-black scheme
The only thing you need to know and pass to the graph script is the ID of the test - this is a "class letter" (currently only L for local-test is used) and a number - for example L26.
This is passed as the variable testid in the URL.
Security
In order for your graphs to be visible to web browsers not authenticated into FreeNATS you need to set the test.graph.public system variable to 1.
You can optionally set the variable test.graph.key to an alphanumeric string. Requests from public browsers must now provide this string in the URL as graphkey. Views will automatically use the graphkey.
This will allow you to use your graphs in unauthenticated environments but obviously also means potentially "exposing" your other graphs.
Reporting Period
You can specify the start and end period of the graph using startx and finishx (which default to 0:00:00 and 23:59:59 respectively if unset). These time values can be specified either as 0 (now), a negative number (number of seconds before now) as as a positive number which is taken as "seconds past the epoch" (unixtime).
For example startx=-3600 would start the reporting period one hour before now.
JavaScript can be used to generate the unixtime (and thus the URL) - a full example is given at the bottom but the following illustrates the use of unixtime in JavaScript:
<script type="text/javascript"> var now=new Date(); var unix_ms=now.getTime(); var unixtime=parseInt(unix_ms/1000); var hour_ago=unixtime-(60*60); var day_ago=unixtime-(60*60*24); </script> |
Width and Height
Width and height are set with the width and height variables (in pixels), they default to 700 and 150 respectively if unset.
Range Data
The data range (Y axes range) is controllable by the user by passing one or more of the variables mangemin, rangemax or rangemaxmin.
If a range value is unspecified it uses the relevant highest or lowest point in the data set returned for the period.
rangemin specifies the exact minimum (lowest point) of the scale.
rangemax specified the exact maximum (highest point) of the scale. Results higher than rangemax will be drawn going "off the top" of the graph. The alternative, rangemaxmin, specifies the "minimum maximum" of the range i.e. the rangemax will be this unless a higher data point is encountered in which case rangemax will be the highest point.
Drawing Styles
There are three types of output drawn onto the graph, the "spikes", track and "underline".
The spikes (variable draw_spikes 0 or 1 - defaults to 1 if unset) are the vertical bars drawn from the base to the test result in the colour of the alertlevel (green for passed, red for failed etc).
The track (variable draw_track 0 or 1 - defaults to 1 if unset) is the blue (by default - see the colours section below) track line over the top of the sample data.
The underline (variable draw_under 0 or 1 - defaults to 1 if unset) draws a thick line along the bottom axis in the relevant alert level colour. This is to help visibility of failures where the spike etc is often unseen as the result is 0 or negative.
By default the underline is only drawn (if on) for warning or failure levels. Pass results can be included with the variable draw_under_pass (0 or 1 - defaults to 0 if unset).
Titles and Units
A title can be passed in the title variable (if title is unset the value of nodeid will be used if that is set) and will be displayed centered at the top of the graph.
Units can be passed with the units variable and are displayed next to the Y axis under the rangemax figure. Multiple lines are specified with forward slashes (/) so whereas "MilliSeconds" will encroach on the graph area "Milli-/Seconds" will plot over two lines.
Colours
Colours can be set by passing "itemcol=colour". The items which are available to be set are bgcol (background colour), txtcol (text colour) and axescol (axes colour).
"Named" colours available for use are black, white, red, blue, green, grey, orange, lightgreen and lightgrey.
For example "bgcol=black" gives a black background.
Defaults are a white background, grey axes and black text.
Example
<script type="text/javascript">
<!--

// Setup FreeNATS
var url='http://somehost/freenats/test.graph.php?testid=L100';

// Set Style
url=url+'&draw_spikes=0&txtcol=red';

// Set Dates and Times
var now=new Date();
var unix_ms=now.getTime();
var unixtime=parseInt(unix_ms/1000);
var hour_ago=unixtime-(60*60);
var day_ago=unixtime-(60*60*24);

// Last Hour
document.write('someserver.com last 60 minutes <br>');
document.write('<img src="'+url+'&startx='+hour_ago+'&finishx='+unixtime+'">');
// or we could have done
document.write('<img src="'+url+'&startx=-3600&finishx=0">');

// Last Day
document.write('<br>someserver.com last 24 hours <br>');
document.write('<img src="'+url+'&startx='+day_ago+'&finishx='+unixtime+'">');

-->
</script>
|